Biodiversity Dependencies and Impacts Assessment
Identification and Evaluation of Nature-related Issues Following the LEAP Approach
Following the LEAP approach provided by TNFD, we diagnosed the dependencies and impacts related to nature.
Selection of dependencies and impacts (Locate)
Using the ENCORE*1 method, we selected an ENCORE sub-industry from the operation details to be evaluated. The evaluation results are shown in Table 1.
Table1 Extracting Points of Contact with Nature in the Major Businesses of the Ricoh Group
| Details of operation | Dependencies | Impacts | ||||||||||
|---|---|---|---|---|---|---|---|---|---|---|---|---|
| Groundwater | Surface water | Biomass | Water cycle | Protection from floods and storms due to vegetation | Water use | Water pollution | Soil pollution | Waste | Air pollution | GHG emission | Noise Light Pollution | |
| Manufacture of imaging equipment | M | M | H | H | M | M | ||||||
| Manufacture of imaging equipment consumables | M | H | H | M | H | |||||||
| Production of thermal paper | VH | H | H | M | ||||||||
| Printing Paper Manufacture of thermal paper base paper (Upstream of the Value Chain) |
VH | VH | M | M | VH | H | H | M | ||||
Legend: Impact level: Low→High
| M | H | VH |
*1: A tool for identifying nature-related risks developed primarily by the United Nations Environment Programme World Conservation Monitoring Centre
Identification of priority locations for direct operations (Locate)
We evaluated the status of direct operation sites for water, which presumed a high level of impact in the dependencies and impacts selection phase, and for biodiversity, which is the entity that produces and restores natural capital, to identify priority locations based on the following aspects. The evaluation results are shown in Table 2.
Sensitive location for water resources: “Water stress”, “Water Depletion”, and “Untreated connected Wastewater” labels for Aqueduct*2 are “HIGH” or higher.
- Material location for water resources: Sites’ water usage volumes are relatively high.
- Sensitive location for biodiversity: (1) STAR metrics showing conservation/restoration potential for IBAT*3 are “HIGH” or higher. (2) Zones of high ecological integrity according to field studies are located within the business site. Japan, China, Southeast Asia, and North America were selected as countries or regions which have priority locations.
*2: An assessment tool for water-related risks developed by the World Resources Institute.
*3: An assessment tool for biodiversity-related risks developed primarily by the United Nations Environment Programme World Conservation Monitoring Centre
Table 2. Results of identifying priority locations for direct operations (production sites)
| Object | Evaluation item | Method of identification | Countries and regions which have priority locations |
|---|---|---|---|
| Water | Water stress | Aqueduct | China(2), Thailand(2) |
| Water withdrawal | Internal company data | Japan (5),Thailand (2),North America (1),China (1) | |
| Sensitivity to pollution | Aqueduct | China (5),Thailand (2),Vietnam (1) | |
| Biodiversity | Conservation/ Restoration Potential | IBAT | Japan (12),China (5),Thailand (1) |
| Ecological integrity | Field study | Ena and Gotemba* |
( ) are the number of sites identified within priority locations
* Certified as Nationally Sustainably Managed Natural Site by Ministry of the Environment, Japans
Examination of dependencies and impacts (Evaluate)
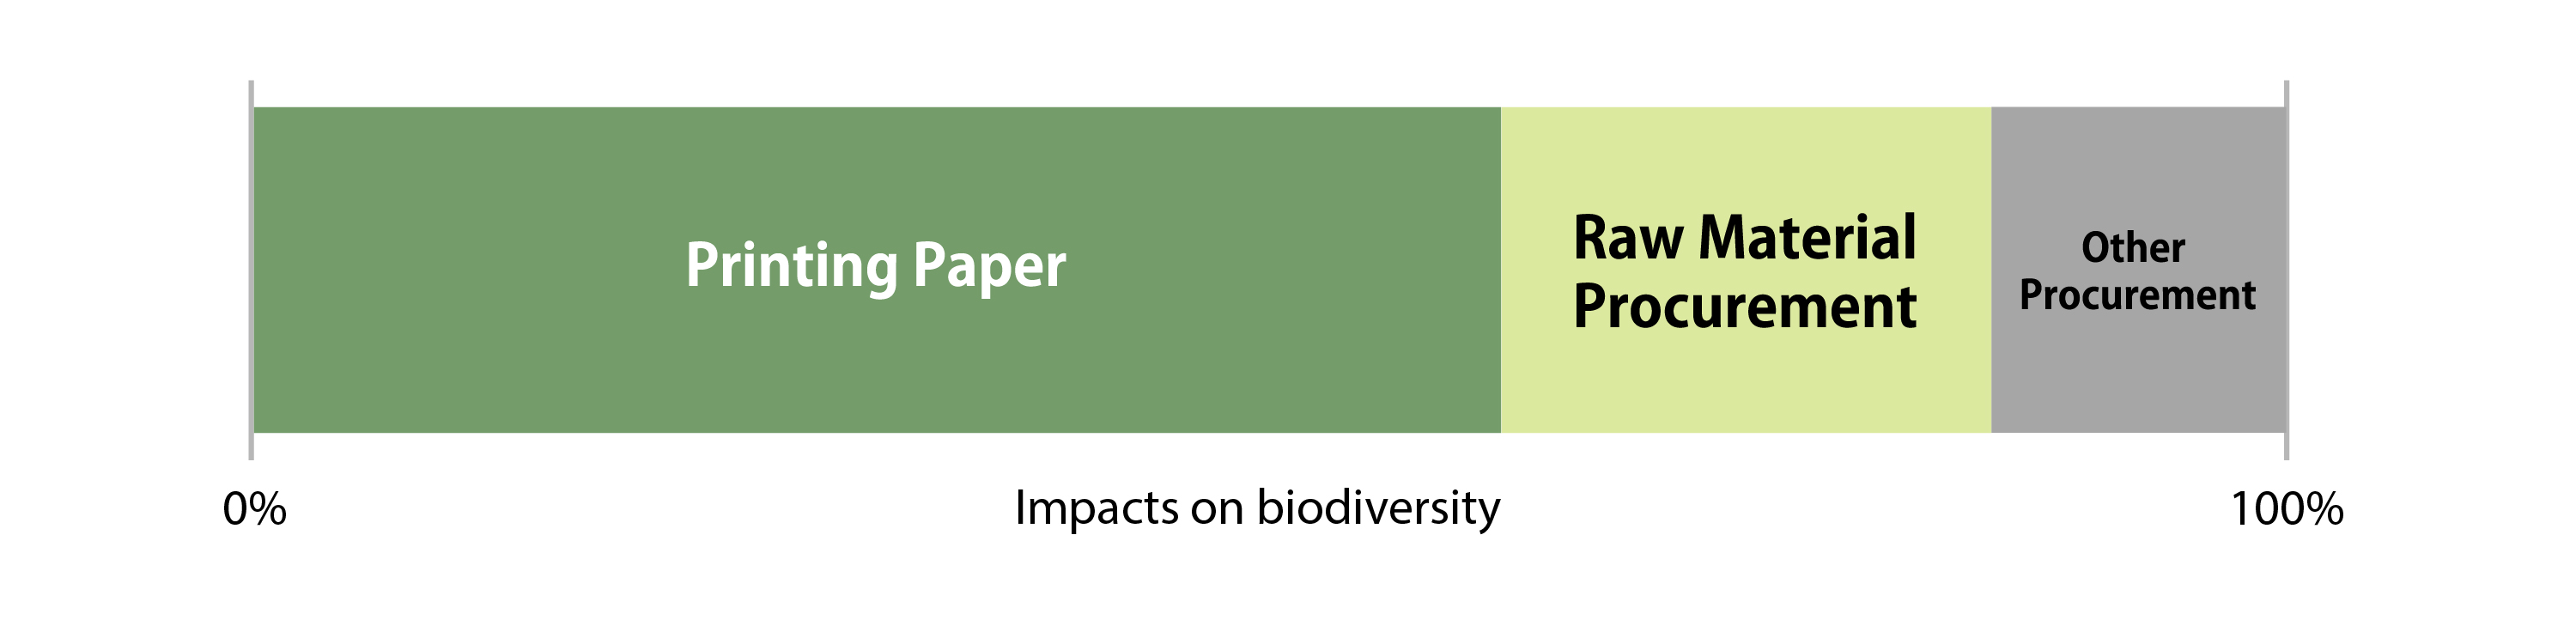
In order to identify key areas of biodiversity, and to understand the scale of impact throughout the value chain, we evaluated flagship Japanese products using the Life Cycle Impact assessment Method based on Endpoint modeling*4. This showed that over 60% (Figure 1) of the environmental load from imaging equipment arises from printing paper, and reaffirmed the importance of procuring sustainable paper
* 4 LIME2 and LIME3 were used in this evaluation.
Figure 1: Impact on Biodiversity through the Value Chain of Imaging Equipment
* Printing paper usage is estimated based on the standard lifetime usage of the products evaluated, taking into account double-sided printing and multiple pages printed on a single sheet of paper.
Excluding the impact of paper, we found that climate change, and the procurement of raw materials had a significant impact (Table 3). These are mainly due to steel plates and resin. A similar evaluation conducted for thermal paper (Table 4) found that there was a significant impact from climate change, and consumption of forest resources at the raw materials procurement stage. These are mainly due to raw materials for base and release paper. LIME does not allow comparisons with other impact categories for water resource. While the ENCORE evaluation indicates a high degree of importance, we can consider the impact of water intake from direct operations to be relatively small, whereas our assessment found a significant impact from paper and cardboard throughout the value chain. We plan to evaluate the severity of water and soil contamination in the future. As part of policy to help reduce its impact, Ricoh Group is expanding use of recycled materials, selling recycled players, and offering silicone-top linerless labels without release paper, and label-less thermal technology that displayed directly on the object to be printed.
Table 3 Environmental impact of imaging equipment (excluding printing paper) by stage of the value chain
| LIME impact category | ||||||||||
|---|---|---|---|---|---|---|---|---|---|---|
| Climate change | Land use | Fossil fuels consump-tion | Mineral resource consump-tion | Forest resource consump-tion | Waste | Biological toxicity (marine) | Biological toxicity (terrestrial areas) | Air pollution | Noise | |
| Relevant natural capital in ENCORE*5 | GHG emissions | ― | ― | ― | Biomass | Waste | Water pollution |
Soil pollution |
Air pollution |
Noise and light disturbanc-es |
| Raw material procurement | VH | M | L | L | M | L | Future evaluation |
The impact on biodiversity is considered small enough for LIME. | ||
| Production | M | L | L | L | L | L | ||||
| Distribution | H | L | L | L | L | L | ||||
| Use and maintenance |
H | L | L | L | L | L | ||||
| End-of-Life | M | L | L | L | L | L | ||||
Table 4. Environmental impact of thermal paper on each stage of the value chain.
| LIME impact category | ||||||||||
|---|---|---|---|---|---|---|---|---|---|---|
| Climate change | Land use | Fossil fuels consump-tion | Mineral resource consump-tion | Forest resource consump-tion | Waste | Biological toxicity (marine) | Biological toxicity (terrestrial areas) | Air pollution | Noise | |
| Relevant natural capital in ENCORE*5 | GHG emissions | ― | ― | ― | Biomass | Waste | Water pollution |
Soil pollution |
Air pollution |
Noise and light disturbanc-es |
| Raw material procurement | VH | H | L | L | VH | L | Future evaluation |
The impact on biodiversity is considered small enough for LIME. | ||
| Production | H | L | L | L | L | L | ||||
| Distribution | M | L | L | L | L | L | ||||
| Use and maintenance |
M | L | L | L | L | L | ||||
| End-of-Life | H | L | L | L | L | L | ||||
Legend
| L <1% |
M ≧1% |
H ≧5% |
VH ≧30% |
Values are percentages of contribution to biodiversity as calculated by LIME.
*5 Items not selected as dependencies or impacts in the ENCORE evaluation, or items with low dependence or impact are indicated with: [-] AIST-IDEA Ver.3.4 is used as the inventory database.